4. Visualizing the Results
After executing the experiment in the server, you are redirected to the Results page. This page is divided into three sections: Bar Chart, Raw Results, and How to Read the Metrics.
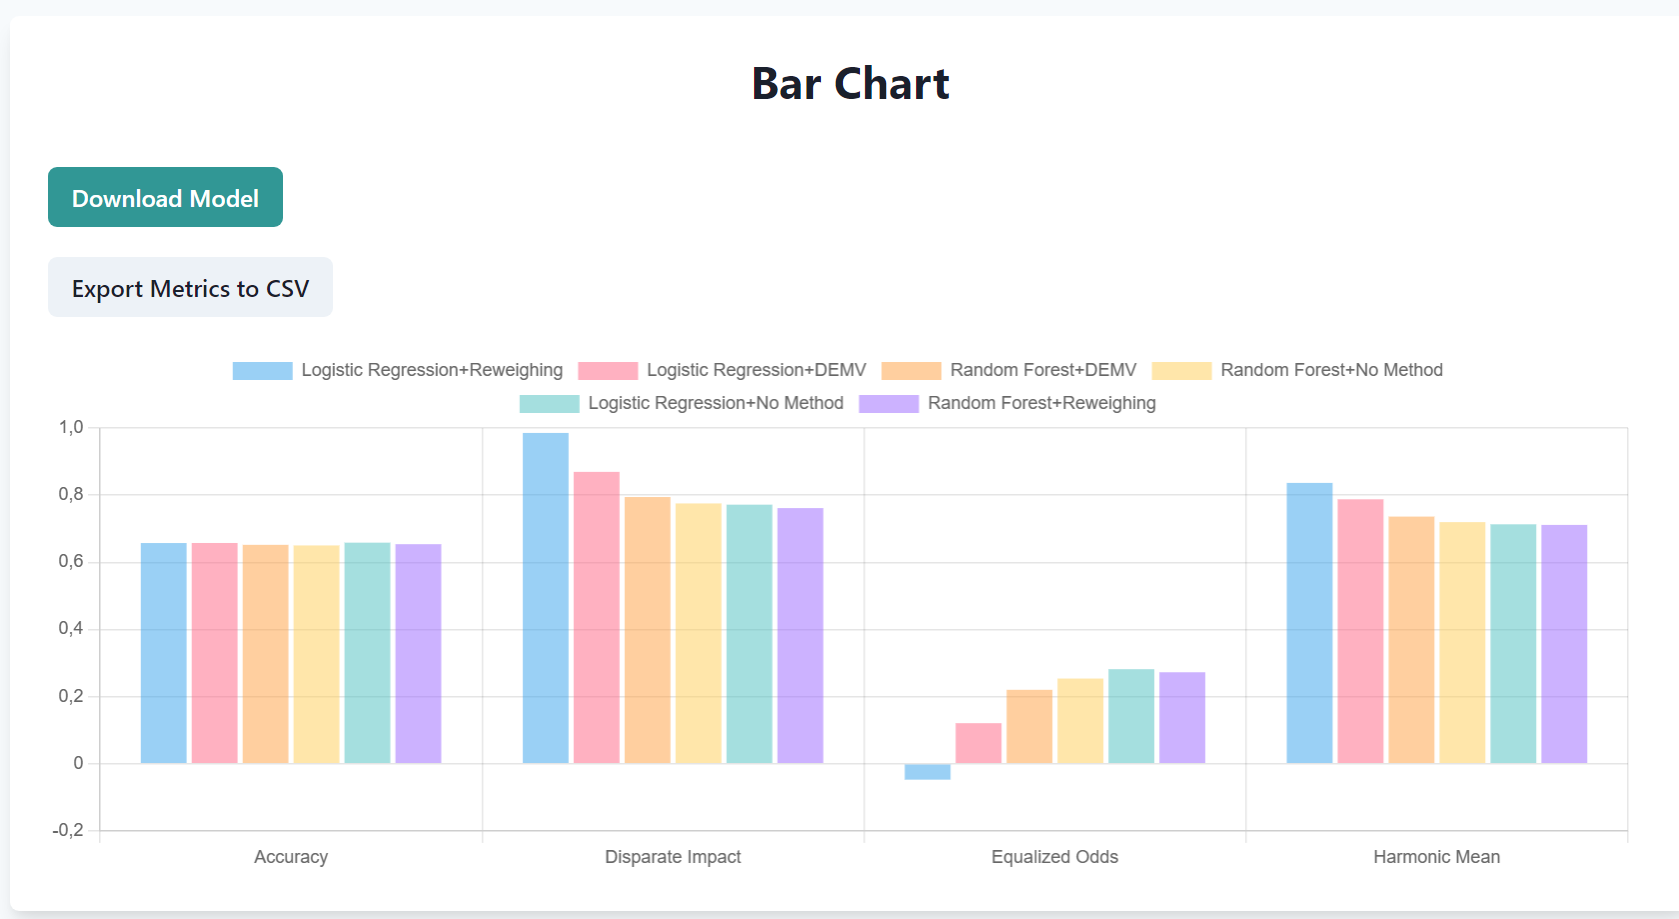
The first sections shows the obtained metric for each setting in a bar chart. As you can see from the harmonic mean, Logistic Regression + Reweighing is the setting obtaining the best fairness and effectiveness trade off.
You can see the same results in the Raw Results section and understand how to read the metrics in the last section.
Finally, you can download the results and the fully trained ML model by clicking the buttons above.
Tip
Congratulations! You have evaluated the fairness and effectiveness of different ML settings and identified the best one using MANILA!